How profilers lie: the cases of gprof and KCachegrind

February 2nd, 2013

We'll see how gprof and KCachegrind lie to us and why they do so, discuss the limits within which we can trust them nonetheless, and attempt to draw more general conclusions about profilers and profile visualization tools.

(In case your programming vocabulary is different from mine – I use "lying" in its dispassionate meaning of "communicating falsehoods" and not to convey negative judgement; on the contrary, I'm indebted to the authors of profiling tools both as a user and a developer of such tools.)

So, consider a program with two parts – an easy part and a hard part. Both parts do similar work but one part does much more work than the other:

void work(int n) {
  volatile int i=0; //don't optimize away
  while(i++ < n);
}
void easy() { work(1000); }
void hard() { work(1000*1000*1000); }
int main() { easy(); hard(); }

Here, work() is a do-nothing loop. easy() executes a thousand iterations of that loop and hard() executes a billion iterations. We therefore expect main() to spend most of its time in hard() and only a tiny fraction in easy().

Now let's profile the program with gprof:

gcc -o try try.c -pg
./try # saves stats to gmon.out
gprof try gmon.out

On my machine, this prints the following info:

self            self    total
seconds  calls  s/call  s/call  name
   3.84      2    1.92    1.92  work
   0.00      1    0.00    1.92  easy
   0.00      1    0.00    1.92  hard

gprof's lie is marked in red; it says easy() and hard() took the same amount of time, instead of hard() taking a million times more to run.

What happened? Can we trust anything that gprof says? Which parts of its output are entirely wrong like this "easy() is the same as hard()" business and which parts are roughly correct, give or take a measurement error? To answer this, we need to briefly discuss how gprof works.

Roughly, gprof's two sources of information are profil() and mcount():

With this in mind, we can roughly tell what gprof knows. Specifically, it knows that:

What about the share of time easy() spent in its call to work(), and the share of time hard() spent in work()? By now we know that gprof knows absolutely nothing about this. So it guesses, by taking 3.84 – seconds spent in work(), a reliable number – and divides it between easy() and hard() equally because each called work() once (based on mcount(), a reliable source) – and we get 1.92. This shows how bad results can be produced from perfectly good measurements, if passed to the wrong algorithm.

More generally, gprof's output falls into the following categories, listed in decreasing order of reliability:

BTW, the fact that gprof lies doesn't mean that its documentation does; on the contrary, `man gprof` says, in the BUGS section:

The granularity of the sampling is shown, but remains statistical at best. [this refers to the limited reliability of profil's histogram.] We assume that the time for each execution of a function can be expressed by the total time for the function divided by the number of times the function is called. Thus the time propagated along the call graph arcs to the function's parents is directly proportional to the number of times that  arc is traversed. [this refers to the absolutely unreliable way in which profil's "self time" data is combined with mcount's call graph data.]

Unfortunately, users tend to read tools' output without reading documentation. (The ability of users who aren't into profiling tools to understand the implications of this passage is a separate question.)

The man page also refers to papers from 1982 and 1983. An age of over three decades is a good reason to cut a program some slack. In a way, gprof's age is not only a source of its limitations, such as only 100 samples per second, but also a source of its strengths, such as fast execution of profiled code and wide availability.

Now let's look at a more modern profiler called callgrind – a valgrind plugin. Being more modern, callgrind has a few advantages over gprof – such as not lying in its call graph (though some would debate that as we'll see), and coming with a GUI program to visualize its output called KCachegrind.

KCachegrind the viewer (as opposed to callgrind the measurements collector) does lie in its call tree as opposed to call graph as we'll shortly observe. But first let's have a look at its truthful reporting of the situation with easy() being easier than hard():

KCachegrind's call graph - true

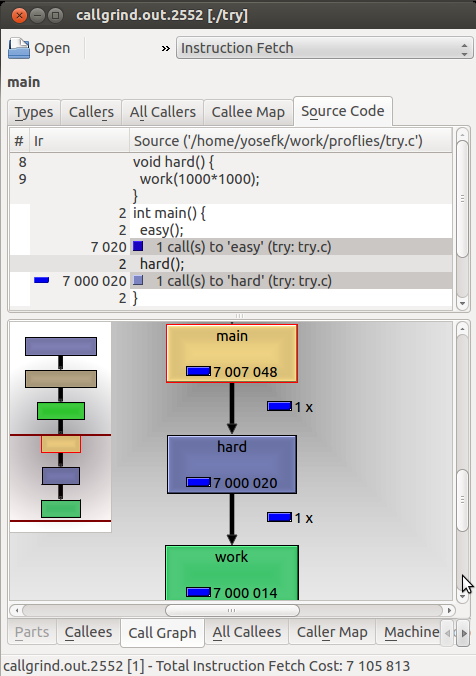
As you can see, easy() isn't even shown at the graph (KCachegrind hides things with insignificant cost); you can, however, see the cost of main's call to easy() and hard() at the source view – indeed easy() is ~1000x faster than hard().

Why 1000x and not 1000000x? Because I changed hard() to run a million iterations instead of a billion, bringing the difference down to 1000x. Why did I do that? Because callgrind is slow – it's based on Valgrind which is essentially a processor simulator. This means that you don't measure time - you measure things like instructions fetched and cache misses (which are interesting in their own right), and you get an estimation of the time the program should take given these numbers and your processor model.

It also means callgrind is slow. Is it slower than gprof? Not necessarily. With gprof, code runs at near-native speed, but you only get 100 data points per second. With callgrind you get much more data points per second. So for a hairy program, with callgrind you get statistically significant data more quickly – so effectively callgrind is faster.

But for a simple program with just a couple of hot spots, callgrind is slower because if the program has a costly part 1 and then a costly part 2, it'll take callgrind more time to even get to part 2, whereas gprof, with its near-native speed, will give you good enough data from its fast run.

So much about speed; now let's look at a case where KCachegrind lies to us, and then we'll discuss why it happens.

To expose the lie, we'll need a more complicated program. We'll achieve the required complexity by having two worker functions instead of one, and then adding a manager – a function that does nothing except calling the two workers with the number of iterations to run.

How does the manager decide the number of iterations each worker should run? Based on the project requirements, of course. Our "projects" will be two more functions, each calling the manager with its own pair of iteration numbers for the two workers.

void worker1(int n) {
  volatile int i=0;
  while(i++<n);
}
void worker2(int n) {
  volatile int i=0;
  while(i++<n);
}
void manager(int n1, int n2) {
  worker1(n1);
  worker2(n2);
}
void project1() {
  manager(1000, 1000000);
}
void project2() {
  manager(1000000, 1000);
}
int main() {
  project1();
  project2();
}

As you can see, both workers work on both projects, but each project is mostly done by one of the workers, the other contributing 1000x less work. Now let's see what KCachegrind says about this; we need to run callgrind, which can be done without special compilation flags:

gcc -o try2 try2.c
valgrind --tool=callgrind ./try2
kcachegrind `ls -tr callgrind.out.* | tail -1`

Here's what we'll see:

KCachegrind call tree - false

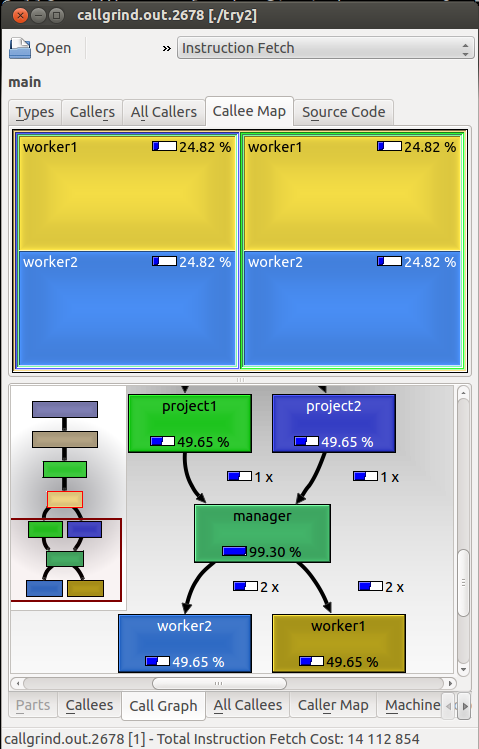
The bottom part of the screen shows us truths, but the top part shows falsehoods.

The truth is that each project called the manager once; the manager called each worker twice; and each worker did half the work in the program – all shown at the call graph at the bottom. However, at the top, each of the project functions occupies half the window and shows that worker1 and worker2 each did half of the work in each project - which couldn't be further from the truth.

This falsehood is reported by the call tree (or "callee map" as KCachegrind calls it) – a view which is supposed to show, for each function, the share of work done in each of its callees relative to the work done by all those callees together (as opposed to the call graph which only links to the called functions and tells how many times they were called by that caller – and their share of work in the entire program.)

Why does the call tree tell a falsehood? Again, because it doesn't know the truth. KCachegrind visualizes callgrind's measurements, which include the number of times f() called g() and the time spent in calls from f() to g().

This is more that gprof's information – way more. gprof only knows how much time was spent in f() and g(), and how many times f() called g(). Callgrind also measures how much time was spent in g() specifically when it was called from f(). In particular, this means that KCachegrind's source view gives a perfectly reliable measurement of the time spent in f plus all its callees – something which users take for granted and something which gprof only guesses, often wildly wrongly.

However, this information is not enough to know what the call tree needs knowing to show the truth. Specifically, you only know that manager() spent the same time in calls to worker1() and worker2() overall; you have no idea how much time it spent in each worker when called from project1() and project2(). So you can't reliably plot the share of time worker1() and worker2() spent inside project1() or project2(); you can only guess, often wildly wrongly.

(In fact, you can't tell if manager() even called worker1() when called from project1(); perhaps it didn't – all you know is that manager called worker1() in some context. Some people conclude that the call graph is "incorrect"; in fact it is correct, the question is if you understand what you see the way you're supposed to – you aren't supposed to think that every path through the graph actually happened, only every edge. Another question is how upset you are when you find out (someone with a lot of "manager" functions doing nothing but dispatching might be very upset.) This example certainly broadens the gray area between "truth" and "lies" in profilers' output.)

Callgrind has something which appears like a possible workaround: --separate-callers=N. What this does is it measures things per call stack of size N instead of per call "arc". That is, instead of having a measurement for the arc from manager() to worker1() and a measurement for manager()->worker2(), it measures separately for project1()->manager()->worker1(), project1()->manager()->worker2(), project2()->manager()->worker1(), etc.

Unfortunately, KCachegrind didn't manage to open the resulting output file on my machine, nor did it help when I replaced the ticks (') separating the function names (which get concatenated together) with underscores (_). However, the textual data produced by callgrind indeed shows the truth:

fn=(726) worker2'manager'project1
5 3
+1 1
+1 7000008
+1 2

fn=(736) worker2'manager'project2
5 3
+1 1
+1 7008
+1 2

This shows that worker2() did 1000x more work when called (through manager()) from project1() than it did when called from project2() – as we know it did.

Having looked into the details of two particular examples, we'll proceed to a more general discussion of profilers and profile visualization tools.

Using no profiler at all is better than hoping it'll save the day

I know a few people who like to optimize code and think optimization is important, and who mostly ignore profilers. I know a few other people who claim that a good profiler is the necessary and sufficient prerequisite for optimization. More often than not, such people are not particularly fond of optimization, and their code will be slower than the code of above-mentioned profiler-bashers, before as well as after optimization.

The examples above supposedly show a part of the reason why "a good profiler" is not at all trivial to use.

Basically among the many opinions, there are two extreme ones sounding along the lines of:

  • You don't know where your bottlenecks are going to be, therefore don't bother to optimize before measuring.
  • You don't know where your bottlenecks are going to be – nor will you be able to measure them because adequate measurement and analysis tools plus test scenarios covering the relevant possibilities are hard to come by. Therefore, conserve resources if there's even a slight chance that the code will be a bottleneck.

In my experience, the first viewpoint results in slower code and is less consistent internally. That is, for someone who's not into optimization, a profiler is just not the force multiplier that he thinks it is. That's because he won't put the mental effort required to make an effective use of the profiler for the same reasons making him write slow code in the first place: he just doesn't like all this performance stuff.

The trouble with this being that profilers are not things magically telling you what to do without concentration on your behalf.

You need to understand how a profiler works to use it well

When I first realized how gprof lies in its call graph, I was so offended that I stopped using it for a long while. The problem with profilers is that not all the data is gross lies, but some is, and without knowing which data is likely to be wrong, you might trust things that you shouldn't, scratch your head to the point of hair loss, and then abandon the tool altogether once you realize how it routinely betrays your trust.

With KCachegrind, I came up with the example where it lies based on my knowledge of the callgrind output format – something I know because we (specifically, GK) added support for that format to our in-house profiling tools at work. I wouldn't guess that the Callee Map view is unreliable otherwise. Like most users, I rarely read the docs unless something clearly refuses to work altogether. The stats in the call graph as well as the source view are perfectly reliable. How would I know some other stats aren't?

The extent to which you warn the user about possible implications of assumptions in your software is a tough question for all programmers. Should KCachegrind have a big red warning "I might be misleading you" at its "map" views? A "true power user" doesn't need the warning because they know how the tool works anyway. A "truly careless user" wouldn't read the explanation linked to from the red warning and would just be scared away. Only a "middling user" irresponsible enough to not read the docs but responsible enough to read text linked to from big red warnings might benefit from such design. But how many such users are there compared to the rest?

My own experience here is depressing – nobody, not even the smartest folks, is willing to read anything unless they came here to read. As in, when you're a tutorial that people intend to read, you can tell things to people and they listen. When you're an error message, people read you to the extent necessary to make you go away. And when you're a warning, people ignore you. It sucks to be a warning.

So I'm pessimistic about big read warnings. As to tutorials – people don't expect profilers to be complicated enough to warrant a tutorial, so they probably won't allocate time specifically to read one. They're wrong, but they won't.

Choosing a profiler is hard

There's no perfect profiler – it's a tradeoff, or rather a bunch of tradeoffs. Let's see how complicated those tradeoffs are by comparing gprof, callgrind and Google's CPU profiler:

  • gprof is fast, requires a special compilation, gives you "self time" based on 100 instruction address samples per second, precise call counts, and often bogus "children time" information.
  • callgrind is slow, requires no special compilation, gives time estimations based on event counting, several order of magnitudes more data points per second (making it "effectively faster" for some use cases but not others), precise call counts as well as precise "events counted during a call to each child" information, and comes with a viewer giving correct though possibly misleading call graph and often bogus "map" views.
  • Google's CPU profiler is fast, requires no special compilation unless you're on a 64b platform without a working unwind library, uses a configurable amount of samples per second (default: the measly 100, I wonder why), lacks precise call count information, logs full call stacks unlike gprof and callgrind without –separate-callers, but then converts data to many viewing formats where the extra info is lost (such as the callgrind format). You do get more informative view of the profiling data in some cases.

So basically each of these profilers is better than the rest in some way and worse in some other way (for instance, gprof, at first glance the awful, ancient profiler, is actually your shortest path to precise call counts, which may well be the thing you need the most). And that's before discussing things like the ease of getting a working version for your platform.

As it often is with complicated things, the choice is made harder by the fact that you don't realize many of the implications until after you gained some experience with the tool. I don't think I know what questions to ask about a new profiler, even though I'm relatively savvy. I do realize that I want to understand how it works in a lot of detail.

Not all errors are "noise"

If you're listening to an analogue recording and there's a "shhhh" sound, it's "noise". If, however, someone is yelling near you, then this louder noise isn't "noise" in the mathematical sense – it's another signal. And if someone has overwritten your original recording, then there's only another signal left and none of yours. There's also noise on top of that other signal, but that noise is the least of your troubles.

Not everything standing between you and your signal is "noise"; sometimes it's an error making you look at the wrong signal.

With profilers, people intuitively expect "measurement noise" – a profiler measures time (or some other cost) and no measurement device is perfect. People are willing to accept that – but they do expect fidelity in the assignment of costs to context. "Context" is source lines, functions, and call sequences; people (correctly) think of context as something logical where the concept of "measurement errors" doesn't apply; it's either correct or not.

Unfortunately, people are right, but the conclusion is the opposite of the natural expectation: "context" is indeed a logical concept and not a continuous quantity – and therefore, when the tools give you wrong information, it's really wrong, as in completely detached from reality, and not something "roughly right" give or take a measurement error.

(Our examples focusing on call sequences are rather benign, in a way; for real fun, we could discuss the fidelity of assigning costs to source code lines in optimized programs. Even with a nice assembly listing linking to the various source files from which code was inlined, like the listing provided by KCachegrind, it's... let's say less than easy.)

The upshot is that many errors in profilers' output are not something that can be fixed by running the program more times to get more statistically significant results. Rather, you have to know where the results are only distorted by noise and where there can also be logical errors rendering the numbers meaningless.

Presentation errors can exist without measurement errors

...As evidenced by KCachegrind's false presentation of callgrind's or Google profiler's correct results, or by gprof's false conclusions based on reasonable numbers reported by profil() and perfect numbers from mcount().

To add to the previous point, measurement errors are more likely to be "noise" than presentation errors, which are more likely to tell something unrelated to the truth.

Conclusion

Profiling is trickier than we tend to assume, and as someone developing profilers, I understand programmers who're good at optimization and who mostly ignore profilers. A profiler could help users get way more mileage if it found a way to convince them to actually read a thorough, memorable explanation of its strengths and weaknesses.

1. JerryFeb 2, 2013

Thanks for your post. I find it very timely.

Let me ask you a newbie, but somewhat related question.

I rarely use profilers. Earlier this week, I wrote a program twice. Once using memory mapped IO. Once using streaming IO from the C standard runtime library.

The program itself was pretty simple. It scanned about 10,000 lines of about 150 chars, parsed some data from each line, built a tree out of that, searched the tree, reported on its findings.

To my surprise the memory mapped IO version was about 10 times slower that the streaming io version as in the memory mapped io version took about 5 seconds to complete versus the almost instantaneous response from the streaming io version.

So I used gprof to inspect the differences.

First thing I noted, and if I recall correctly, was gprof was of little value in determining where the problem was, because the hotspot was in the main program, not in any function.

Eventually, because I suspected what might be problematic and put it into a function that was called, I traced the hotspot to:

> while((point < fend) && (*point++ != 'n'));

Now what this line should be implementing is a while loop that scans from the current point in a file to just past the next newline in the file, all the way making sure than point doesn't overrun the end of the file (fend = filebeginning + filesize).

This was a very slow statement to execute.

Now first, this seemed difficult to pinpoint using gprof alone until I placed that line into a function skip, at which point gprof verified that skip was the hotspot.

Second, reading on the note provides me some insight that the reason this statement is slow (assuming I measured it correctly) is due to the kernel having to have a context switch to move each character into userspace when it is conceivable the c standard runtime version with its buffered io needs a context switch only for buffer fills/refills.

So my next question is, what profilers or other tools are out there that would help me understand

1) which statement in a large sequence of statements is slow
2) and if such a statement is slow due to poor interactions with the kernel.

Thanks!

2. EldcFeb 2, 2013

What I take away from this interesting post is this: part of the output of gprof and KCachegrind is not reliable because they try to display data that they did not collect.
But what of the profilers that log the full call stack? They have all the data they need, so they shouldn't be misleading–even to someone who isn't an expert, right?
Unless I am mistaken, the only thing one would need to know before trusting a profiler's output, is whether it logs the full call stack.

3. aleFeb 2, 2013

From someone who has used gprof many times without having a clue of how it works, thank you! I have probably been bitten by this without even knowing.

4. Yossi KreininFeb 2, 2013

@Jerry: I think gprof has an option to list line-level profilers, or at least gcc -pg has a flag to instrument every source line (I'm more sure of the latter than the former and then the question is what's your viewer going to be), but I'm not sure; I don't really use gprof all that often... Callgrind can do a line-level profile, for sure, but as to kernel interactions – I wouldn't know, since most of my development targets an OS-free in-house chip...

@Eldc: there are generally plenty of sources for confusion apart from the ones discussed in the article, but even for these, it's not "100% enough" to know that the full call stack is logged – the question also is what's displayed to you and what it means; as in, Google's CPU profiler that logs the full call stack loses that info when outputting in callgrind format, and KCachegrind showing you the call graph does not mislead you if and only if you understand that not every path actually happened at runtime (I think Google's profiler also displays you such "bogus" paths in some of its views but I'm not sure.)

5. Yossi KreininFeb 2, 2013

@ale: it's not that bad if gprof ultimately points you to a function that can and should be optimized. What really got my goat when I first realized how gprof works was that I had, roughly, a program with a hard part which only ran in offline debugging scenarios, and an easy part which ran in real online runs, and both used the same function, but the easy part used it on much smaller inputs. So what ends up happening is that gprof thinks the easy part takes much more time than it does because it doesn't have callee cost measurement like callgrind, but instead guesses based just on the number of calls. So when I found out that random debugging code affects the estimation of the runtime of the code you're really trying to prodile and gprof points you to a function that, if optimized, would speed up your debugging code more than your "actual" code, I was really disappointed...

6. OlegFeb 3, 2013

Yossi, but how did you end up even using gprof in the first place? Does your target platform not support oprofile or perf?

7. JerryFeb 3, 2013

fwiw, on my system it's –tool not -tool

8. Yossi KreininFeb 3, 2013

@Oleg: erm... because I haven't known about these? which I don't know if I regret :) – because sudo apt-get install oprofile caused a log-out (I'm not awfully happy with that log-out... Linux is impossible to crash, my ass), after which I failed to launch "operf" which is "not found" – I dunno, perhaps I'll try it on a newer Ubuntu at home... and as to perf, I haven't figured out how to use it, either. So if you can spare some info I'd be grateful; particularly with respect to inner workings/limitations (I imagine they're better than gprof in some ways, but I still wonder about their inner workings for reasons described above...)

@Jerry: it's double-minus-tool everywhere – WordPress screws up double minus characters, apparently... Sigh.

9. BillgFeb 3, 2013

For those of us on Windows, the Intel profiler does the right thing (group by function+callstack)
http://software.intel.com/en-us/intel-vtune-amplifier-xe
Does anybody know an open-source profiler for windows that does this too?

Meta comment regarding gprof vs oprofile: it seems to be recurring problem with linux: it serves both as a modern operating system, and as a museum of historical artifacts. Some tools you're only supposed to watch, not touch. Not all tools are labeled :)

10. RomainFeb 3, 2013

@Billg, do you know CodeXL from AMD (it's not open source but it's a free tool) and it can do CPUProfiling (+kind of GPU profiling) :
http://developer.amd.com/tools/heterogeneous-computing/codexl/

11. Michael MoserFeb 4, 2013

This profiler requires you to recompile the code;

http://www.logix.cz/michal/devel/CygProfiler/

the required gcc option -finstrument-functions add a call in function prologue and a call in function epilogue; now the tool hooks this function to do its profiling.

Of course the profiler has its own overhead that skews the picture ...

12. Marius GedminasFeb 4, 2013

@Jerry, when you use mmap, you get at most a single page fault per page (4KB), but IIRC the kernel reads ahead and faults in a number of pages (something on the order of 128K?).

You could inspect the number of minor and major page faults with /usr/bin/time.

My guess would be that the 5x speed difference is caused by the read-based code reusing the same working set of memory pages, while mmap-based code uses new pages all the time, flushing old ones out of the CPU cache.

13. Yossi KreininFeb 4, 2013

@Michael: the trouble with -finstrument-functions the way I understood it is that it instruments even those functions which were inlined; this means a ton of overhead for C++-y code with tiny accessors calling tiny accessors.

14. Michael MoserFeb 4, 2013

On the other hand you have the flexibility to instrument only those source files that are performance critical; Gprof can give you an idea where 80 percent of the time is spent; which is supposedly a minority of the code; then you can selectively instrument the modules that are critical.

15. Michael MoserFeb 4, 2013

I agree that lack of inline is a big skew that alters the picture in big ways. Yes.

16. Bruce DawsonFeb 4, 2013

For those of us on Windows I would recommend Microsoft's xperf, also known as Windows Performance Analyzer. It includes a sampling profiler that goes up to 8 KHz (default is 1 KHz) and the collation of samples according to call stacks (and optionally thread ID) is correct. It also allows separate analysis of why a thread is idle. It is extremely powerful and doesn't lie. However it is complex. I've blogged about how to use it at http://randomascii.wordpress.com/category/xperf/

It is unfortunate that the profiler defects which you point out on Linux have not been fixed. It sounds like many of them are eminently fixable.

17. Jason TFeb 4, 2013

No mention of perf? @Jerry perf is the profiling tool you want. It will show you why your mmap solution is slower. perf is a whole system profiler, so you'll see what the kernel is doing when your program runs.

18. NimrodFeb 10, 2013

What about using Linux 'perf' command?

Supposedly, it does sample the call stack along with the current address. Unfortunately the ancient RHEL5 I'm forced to use at work does not support the perf command.

19. Mike DunlaveyApr 22, 2013

Jerry,
As someone gripped by this, I'm a pest on this subject. My only defense I can demonstrate what I'm talking about. Look here: http://stackoverflow.com/a/1779343/23771
When the objective is speed, in non-toy programs, of course you're right that guessing doesn't go anywhere. The trouble is, where profilers are concerned, where's the beef? I've never seen anyone using a profiler claim more than maybe 40% speedup. That's peanuts. The thing is, there are opportunities for speedup in the code, but if the profiler doesn't expose them, those programmers stop looking. Where are the results? This subject is ripe for a bake-off.

20. RickBeeApr 23, 2013

I tried your sample programs with quantify (part of the purifyplus suite, from ibm/rational). (I've been using quantify instead of gprof for well over 10 years).

Quantify doesn't lie in any of your test cases – then again, it doesn't show the kinds of pretty pictures that the other tools do, and it isn't free. Like callgrind, programs run (much) slower when quantified, but even in non-toy programs they're fast enough to get the answers you need.

Sure it's not free but I think it's worth it

21. Yossi KreininApr 23, 2013

Indeed it might be better than the example profilers I used; I'd need to have some experience to know what it does and how trustworthy it is.

Not being free has other issues apart from having to pay and ration licenses. In my case, I want to feed profiling data obtained using a hardware probe into a visualization tool; non-free tools often don't document their data formats. Can still be worth it if you don't roll your own platform like we do, or if you pay money for the porting of the tools (which I found to be a PITA, again not just because of the money, but because of the more complicated process.)

22. Largo LasskhyvfJun 18, 2013

Are you aware of PTLsim at http://www.ptlsim.org/ ?

23. Yossi KreininJun 18, 2013

I haven't been aware of it; if I ever need to optimize on x86, I'll definitely look into it.

24. Mike DunlaveyApr 13, 2014

You've put a lot of good effort into this, so thanks for that, but there's something that totally mystifies me, and if you don't know the answer that's OK:

Why is it not generally known that a good way to find performance problems is to simply pause the program at random, a few times, and examine the call stack?
As Agner Fog says in http://www.agner.org/optimize/optimizing_cpp.pdf : "A simple alternative is to run the program in a debugger and press break while the program is running. If there is a hot spot that uses 90% of the CPU time then there is a 90% chance that the break will occur in this hot spot. Repeating the break a few times may be enough to identify a hot spot. Use the call stack in the debugger to identify the circumstances around the hot spot."

I talk about this on stackoverflow quite a bit. It is very easy to assume you get what you pay for – it's so simple it must be very poor compared to a nice modern spiffy profiler. In my experience, exactly the opposite is true. You've done a nice job of pointing out how some profilers can be very misleading. The bigger problem is that, even if they are really accurate, there are problems, big ones, that they simply miss altogether. What's more, the accuracy of measurement that they strive for is actually of little value in pinpointing those problems.

I made a 8-minute video demonstrating this: https://www.youtube.com/watch?v=xPg3sRpdW1U

Here's a stackexchange answer explaining the statistical reasons why it is effective: http://scicomp.stackexchange.com/a/2719/1262

25. Yossi KreininApr 13, 2014

Well, in a well-optimized production program the heaviest single function takes 5% and it falls off from there. You still need to optimize further. What do you do?

Also – trace-based or simulation-based profilers are extremely accurate in terms of measurements and they give you source-line-level and assembly-level stats. And they count things like cache misses and so on so you know why things are slow.

Your method is fine and I used it myself but a replacement for a profiler it is not.

26. Mike DunlaveyApr 13, 2014

Well, maybe you're right that it's not a replacement for a profiler, but if a profiler were a replacement for it, you could take the program here: http://sourceforge.net/projects/randompausedemo/
and speed it up by over 700x (without looking to see how I did it, obviously). The best I've seen anybody do so far, without random pausing, is about 70x.
If you have a profiler that can show you what things to fix, let me know, because that's news.

27. Yossi KreininApr 13, 2014

Different people work on different things. Profilers have their place, and there are situations where random pausing is hopelessly inadequate. Saying that profilers giving enough insight to "get things fixed" are news is kinda extreme.

28. Bruce DawsonJun 11, 2014

I've been using perf on Linux, configured to record 1,000 samples per second. Like ETW/xperf on Windows it grabs a call stack with each sample. These call stacks allow the samples to be properly overlaid in order to avoid lying. I use Brendan Gregg's flamegraph script to graph the data, which I have also used on Windows:

http://randomascii.wordpress.com/2013/03/26/summarizing-xperf-cpu-usage-with-flame-graphs/

So there is hope. My one complaint is that I'd like better ways to browse the perf data — any suggestions one other tools for browsing the sampled call stacks from Perf?

29. Mike DunlaveyNov 1, 2014

What I'm interested in is showing people how to get maximum performance, not how to be proficient in tool use.
Call it extreme if you like, but the proof's in the pudding. There are big speedups that random pausing can see that even the best profiler cannot.

This shows the scientific reasons why it works:
http://scicomp.stackexchange.com/a/2719/1262

This shows how problems can hide from profilers:
http://stackoverflow.com/a/25870103/23771

IMHO, a good profiler is one that gets stack samples, including precise call sites (so it gets line-level cost), on wall-clock time (so it can detect needless blocking), and reports line-level percent stack occupancy. (Recursion is a non-problem.) Zoom does this, there may be others.
But nothing compares in efficacy to human examination of the samples, because no profiler's summarizing back-end is as smart as a human, and the objection that a human cannot examine enough samples is a red herring, because any speedup big enough to be worth fixing will appear in 10-20 samples.

Here's the example of getting a speedup of almost three orders of magnitude by finding six successive speedups:
http://scicomp.stackexchange.com/a/1870
but skipping any one those speedups would have resulted in far less.

30. Yossi KreininNov 1, 2014

When you have 20 people each optimizing their own part of a huge program, and with each person responsible for 5% of the runtime of which they try to cut 40% (so 2% of the current total runtime) over the course of several weeks (so each improvement might be fairly small), how would you use random pausing?

From another angle – how do you define "a speedup big enough to be worth fixing"?

31. Mike DunlaveyNov 1, 2014

Check the links – it's all there.

32. Mike DunlaveyNov 3, 2014

Were the links helpful? To respond to your question, it presumes that performance issues divide themselves up by different peoples' modules. Rather, the division should be by execution phases as perceived by the user, like "this particular page takes a long time to appear". Stack samples during that time will show why, and the fix is likely to require changes to more than one module. The real difficulty is – how do you get disparate people to make those necessary changes? If they refuse, or merely temporize, what do you do? Here's one of my experiences with this:
http://programmers.stackexchange.com/a/101869/2429

33. Chris EDec 9, 2014

I realize it's a long time since this post was made but I suspect if you stepped through your code in gdb or even checked an assembly output you might find no lying as you are accusing this of.

the problem is this code:
while(i++ < n);
you might have marked i as volatile but it's a stack variable local to the function and thus can be safely tossed into a register.

the x86 code to implement this is essentially

get value from stack
compare value to argument
add 1 immediate to register
store value back on stack
compare initially retrieved value to limit
test equality
conditionally jump to start.

now since these are some of the most basic instructions and the data will stay in the processor cache we can assume each executes in 1 processor cycle. the loop is 7 instructions long(acctually 8 with a nop from objdump -d)

we can round up to 10.

now my processor is 1.6 GHz. that means 1,600,000,000 instructions per second.

gprof claims to have granualrity to .01 second.
so 1,600,000,000 * .01 gives us 16,000,000 instructions per recordable time. our loop is 10 instructions we claim, so we can have up to 1,600,000 loop iterations per recognizable time. which means to get useful information from gprof you should consider for my slow processor having easy execute work a minimum of 1.6M times and then hard being a multiple higher than that.

adjust the numbers for your processor speed and give it a try.

If you are interested I'll break down the problemw with the callgrind example for you with the overly simple workload too.

34. Yossi KreininDec 9, 2014

Well, did you give it a try? I say, run it for a year and it'll still split the work evenly between easy() and hard(). Because the problem has nothing to do with measurement granularity, and everything to do with how gprof analyzes its measurements when it produces the report. It simply doesn't take call stacks into account and instead, having measured the time spent in each function, assigns an equal share of that time to each caller. Meaning that if you'd inline work(), you'd see the difference between easy() and hard(), otherwise you won't.

35. Yossi KreininDec 9, 2014

And here's where gprof docs explain it (quoted in the article):

"We assume that the time for each execution of a function can be expressed by the total time for the function divided by the number of times the function is called."

Since work() was called twice, once from easy() and once from hard(), gprof assumes we spent half the total time in each call.

36. Chris EDec 9, 2014

yeah I totally see what I did now. I love problems but tend to get too focused on them. I totally went down the rabbit hole till I lost track of how I got there. In short o try and make up for the lack of basic block profiling in current versions of gcc I added another function in the while and that got me more detailed counts for callgrind and gprof.

37. lolDec 20, 2014

If you want to analysis deeply, in real count of the operation, then you should also check the time in the architecture. Even if you give a restriction on the compiler, you couldn't restrict the behavior of the architecture. Learn about vector processing in your architecture before you use a loop. How can you just assume that your architecture will run your code sequentially without reordering and optimizing in a loop?

38. Yossi KreininDec 21, 2014

Well, strictly speaking, since this is a normal memory variable, and I used no barrier instructions, a processor might in fact legitimately optimize the loop away; however, no commercially significant CPU out there actually does this.

Also... "vector processing" in a loop doing nothing but modifying a volatile variable? "lol" indeed.

39. JosefWJun 16, 2015

Hi, kcachegrind/callgrind author here.

I just found this article now, and it makes a good point about the issues with KCachegrinds heuristical visualizations. Let me explain a bit.

The question how many data to collect and how to visualize something in a meaningful way actually has a lot of tradeoffs, as was mentioned. Typically, added overhead is the argument: as the profiler runs on the same hardware it is expected to measure, any error can be as high as the overhead (error compensation techniques have their limits). Even without gprof's heuristic which often can go very wrong, the added code just for the call counter increment can easily result in more than 100% overhead with short functions, and thus in useless data.
Sampling instead is quite nice, as it allows tuning the overhead. Still, one has to remember that data is statistical and full unwinding at sample points can be a source for significant overhead.

Callgrind actually does not have this problem with overhead or statistical measurement, and could provide exact data with exact call chain contexts. Unfortunately, with complex code, the number of call chain contexts easily explodes, and you have to limit it, unless you want callgrind to run out-of-memory.

But there is another reason that the default limit for call chain lengths in callgrind is only 1: I never came around to implement the needed additions in KCachegrind. Yet, at that time I was interested in more complete call graph visualizations, playing with meaningful heuristics. While I am happy about the widespread use of KCachegrind, it is unfortunate that there still are these issues, which really should be fixed. I like to make a 1.0 release at some point :-)

A bit about the heuristics: with call chain length 1, you actually only have full data of direct callers/callees of a function. Presenting this information usually is called a "butterfly", and that is what "callgrind_annotate –tree=both ..." is showing. KCachegrind is using this butterfly information to extend both call trees (tree map) and call graph; BTW, even the latter can go wrong.

Also from my experience, users do not read documentation. A solution for now would be to reduce all call graph visualizations in KCachegrind to butterflys. But actually there is value in heuristics, as even with limited information, one can come up with insightful presentations. Even if I have call chain contexts with length 5, I want to show call chains in the call graph with larger lengths.

What do you think about adding a "Be honest!" knob in the GUI which restricts visualization to the actual available information without heuristics, and this being the default?

40. Yossi KreininJun 16, 2015

Hi there :-)

First of all I think I lied in the above, actually... I recall that I realized that I got some of it backwards but I never got to fixing the text... I hope to fix it one day...

Regarding a "be honest" knob – I think something along those lines could be nice... I wrote internal docs about KCachegrind which show the non-heuristical parts in green and the rest in red... Needless to say, few people read said docs.

One thing that I did in a profiler was collect full, precise call trees instead of graphs (so you know the call stack of every call and you render a tree) and actually it did not explode, the only trouble was that I couldn't handle recursion which didn't bother me but could be a problem in a general-purpose tool.

Thanks a lot for KCachegrind, BTW! We retried our internal text/HTML profiler front-ends in favor of KCachegrind, for many reasons including the ability to display many different costs, render graphs dynamically, search things nicely, handle inlining gracefully, etc.

Two things that'd be really nice to have are a source view where you can copy text and the file path and/or open the file in an editor easily, and self-contained profiling info files, with the source code quoted and all. (People very often change or delete the source files and then the profiling data becomes useless; often a profiling takes time to obtain and one would really like to look at the data despite the source files at the original location no longer being there. Or you don't know that they changed the files and you wonder why things look strange.) (I guess the honorable thing would be to submit a patch instead of writing the above :-) Anyway, thanks again for the great tool...)

41. JosefWJun 16, 2015

Ok, my comment about call context explosion was perhaps a bit exaggerated, but this depends very much on the application. Profiling a browser start/rendering of an HTML page will definitly give a quite large calling context tree, and I expect a tool to handle such cases without problem.

Thanks for the suggestions!

I already thought about extending the format to allow self-contained profiles, but more for machine code for dynamically JIT-generated code. But for source, it definitely also makes sense, and should be quite easy.

Another option would be KCachegrind calling external, custom shell scripts, e.g. to get at source. Such a custom script could fetch from a repository or a remote machine.

And of course I accept patches!


Post a comment